There are many factors to consider when buying an all-electric car (BEV)
Some of the most important ones are:
• Wells-to-Wheels carbon emissions
• Battery Capacity in kWh
• Battery efficiency in miles/kWh, MPGe, kWh/100-miles. I prefer miles/kWh since kWh is what I pay for and it is easy to memorize.
• Range in miles, which is a function of battery capacity and efficiency
• Price
This article is an attempt to quantify the first five of these factors.
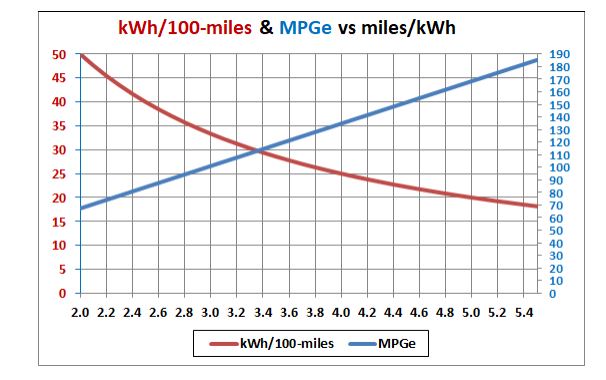
The following graph shows how kWh/100-miles and MPGe are related to miles/kWh:
The value of kWh/100-miles is useful to calculate how much energy in kWh is required to travel a specific distance in miles. The value of MPGe (MPG-electric) is useful to compare the efficiency of a BEV to a gasoline car’s MPG. MPGe is calculated using the EPA number that one gallon of unleaded regular gasoline when fully combusted produces 33.7 kWh of heat.
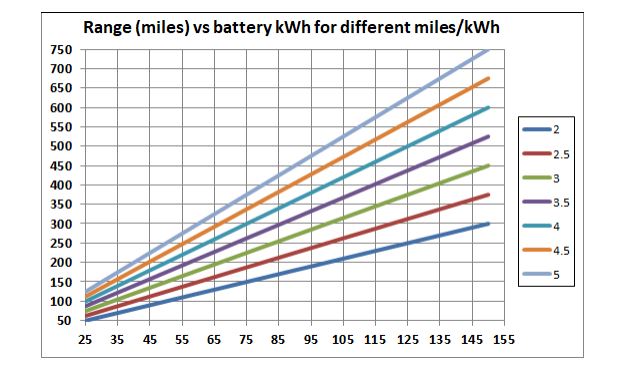
The following graph shows how range (miles) varies with battery capacity (kWh) for seven values of miles/kWh:
Range can be calculated as Range(miles = Battery-Capacity(kWh)*Miles/kWh. Unfortunately, auto companies often do not list range and/or efficiency for their BEVs. Some do not list either. However, reviews by car reviewers often list one or both. But, sometimes the range listed is for the European Driving Cycle (NEDC) rather than the U.S. EPA Driving Cycle. The NEDC range value for a specific BEV is always considerably larger than the EPA range, which means that the miles/kWh is always larger.
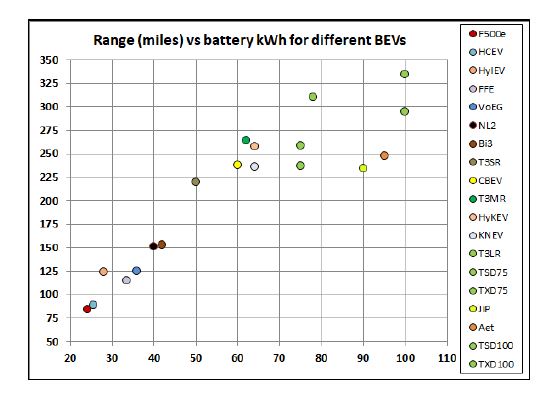
To complicate matters the European Union, Japan and India have defined another Worldwide Harmonized Light Vehicles Test Procedure (WLTP), which value lies between the NEDC and the EPA value. It is often not clear in a BEV review article which of the three test numbers is given. So the range numbers in the following graph for range vs battery-capacity for several BEVs may not all be EPA values:
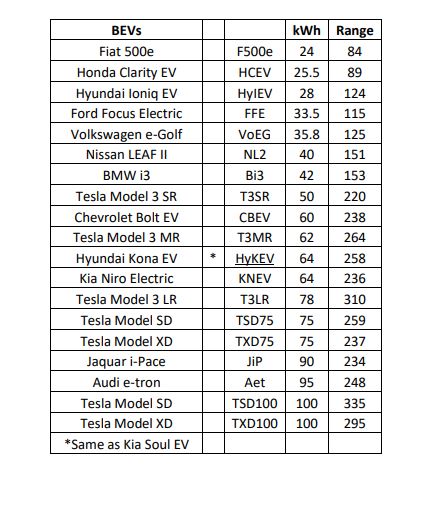 *Note that BEV efficiency (range) varies widely for high battery capacity
Union of Concerned Scientists has calculated the 2016 equivalent MPG for a gasoline car to equal the driving carbon emissions of a typical BEV in various regions of the U.S. The sales-weighted average for the U.S. is 80 MPG, which will increase if electric-power sources become more emissions free. The different regions vary from 38 MPG to 191 MPG. (See the map.) Of course, if you have enough solar panels on your house, the gasoline equivalent MPG is very much higher.
Union of Concerned Scientists have calculated the “Wells-to-Wheels (WtW)” carbon emissions of average gasoline cars and average BEVs in the U.S.. It was found that BEVs have about one-third WtW of gasoline cars for the U.S.
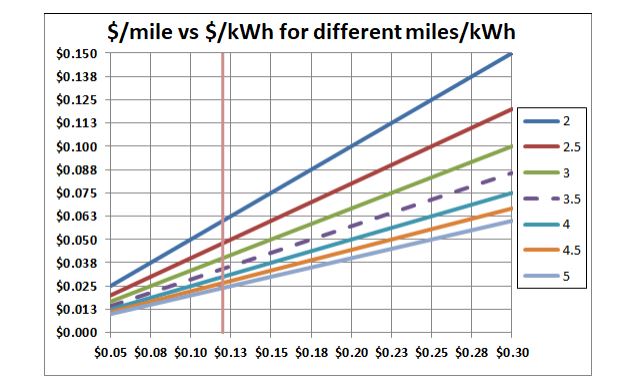
Here is a graph that shows driving costs for BEVs:
The dashed line (3.5 miles/kWh) is my estimate for the average BEV in 2018.
The average cost of electricity for the last several years has been about $0.12 (vertical line).
The average (dashed line) crosses the vertical line at about $0.035/mile.
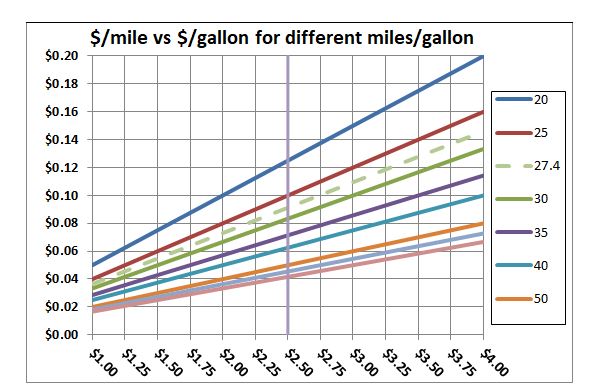
Compare to this graph that shows driving cost for gasoline cars:
The dashed line (27.4 MPG) is for the average gasoline car in the U.S. for 2016.
The average cost per gallon for the last several years I estimate at $2.50 (vertical line).
The average (dashed line) crosses the vertical line at about $0.09/mile.
http://www.roperld.com/Science/My5BEVs.pdf
http://www.roperld.com/Science/TM3LR_SCChargingCurves.pdf
L. David Roper, ROPERLD@VT.EDU, http://www.roperld.com/personal/roperldavid.htm 4 January 2019
*Above web addresses are not secure.
Source: Electric Vehicle News

