

In order to maximize an EV’s range for a given battery capacity and vehicle weight, engineers try to eke out as much performance as possible from the electrical and mechanical systems. Using a process called efficiency mapping, they determine the “sweet spots” of a powertrain—the regions of the torque-speed curve where the system operates at peak efficiency—and design the components to operate in the maximum efficiency zone as much as possible. The problem is that efficiency mapping is a costly and time-consuming process, often occupying expensive equipment for weeks on end.
Using a process called efficiency mapping, engineers determine the “sweet spots” of a powertrain—the regions of the torque-speed curve where the system operates at peak efficiency. This is a costly and time-consuming process.
To test and optimize powertrains, automakers turn to companies like HBK, a provider of test and measurement equipment. HBK’s systems are used to evaluate all aspects of an EV’s powertrain, including the motor, controller, gearbox and inverter. The company says its latest product line, the eDrive Power Analyzer packages, can dramatically reduce the time it takes to create an efficiency map.
Charged recently spoke with HBK Engineer Mitch Marks, who described how eDrive Power Analyzers employ an innovative digital algorithm that maps motor efficiency in a fraction of the time that it used to take using analog methods.
Efficiency mapping with cycle detect
Charged: HBK says its process cuts testing time by nearly a factor of ten. What is it about the efficiency mapping process that takes so much time?
Marks: Powertrain efficiency varies primarily with speed and torque, as well as a few other factors. Our equipment measures battery power, inverter power and motor power to determine each component’s efficiency at different torque-speed combinations. Using a dynamometer, we program torque and speed parameters for every point of the vehicle’s operating range, measure the input and output powers of various components, and use those figures to calculate the efficiency of each section. Once the data points have been mapped, we can see details about how the entire propulsion system operates, and the powertrain can be designed to optimize efficiency.
Efficiency mapping sounds simple in principle, since we’re just looking at a few hundred operating points on the torque-speed spectrum. But the efficiency also varies with gear ratio, temperature and even the battery’s state of charge. Suddenly, all these real-world variables multiply into maybe 50,000 unique scenarios for a single powertrain, and that could tie up a testing rig for weeks.
A traditional power analysis uses a technology called a phase-locked loop. Basically, it’s a piece of circuitry that tracks a frequency. It’s an analog thing that is very slow in nature, and usually tuned at 60 Hz. We asked, “Why is everybody using a power-line tool for vehicle development? Your car doesn’t just go 12 miles an hour.”
EV motors run at multiple speeds, so a power analyzer needs to sweep over a range of frequencies in order to test a motor at all those speeds. The problem is that with each frequency change, the analyzer has to wait for the system to stabilize before taking another reading. This adds about 10 seconds to each measurement. Multiply that by 50,000 setpoints and we’re looking at weeks of dynamometer time, and that’s assuming everything goes as planned.
So, we developed a digital algorithm that, in real time, reads the fundamental frequency of the sine wave supplied to the motor, tracks that, and gives you measurements on every half-cycle of the wave. This algorithm is very robust and it gives you an answer in half a cycle of the fundamental frequency, which is a fraction of a rotation of the machine. For example, for a 20-pole machine, it takes a measurement every 10th of a rotation. We call it cycle detect, and we use a cool digital algorithm to do it.
A map with 50,000 scenarios will take around 10 hours, whereas the old method might take 10 working days or more.
The cycle detect algorithm takes measurements on every zero crossing of the inverter sine wave, essentially giving two measurements per cycle. This allows a power map with 300 unique conditions to be completed in a few minutes. A map with 50,000 scenarios will take around 10 hours, where the old method might take 10 working days or more.
Real-time mechanical and electrical measurements
Charged: What exactly are you measuring during efficiency map tests?
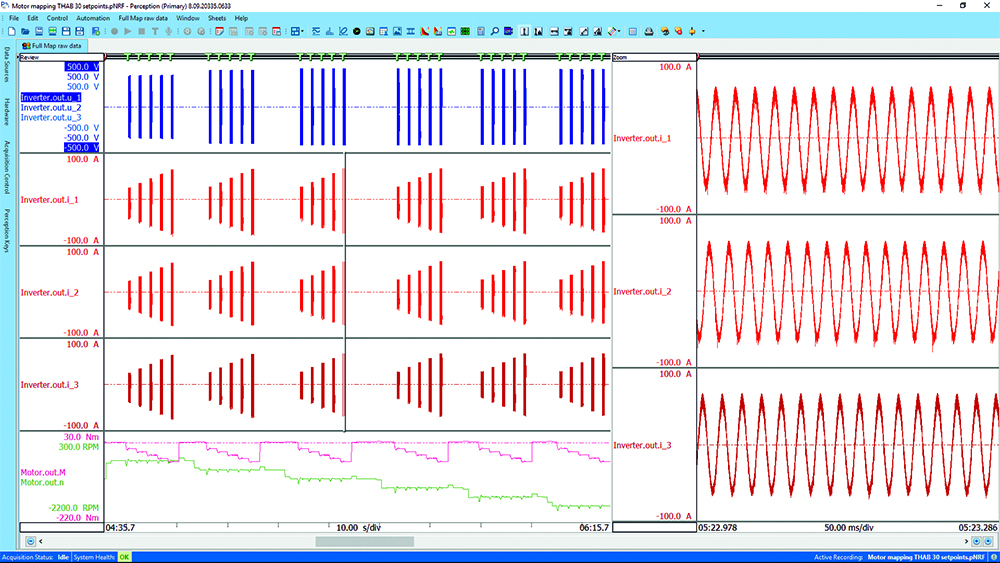
Marks:We’re measuring DC bus voltage and current, inverter voltage and current, inverter input power and inverter output power. The inverter goes to the motor, so we’re measuring the motor’s torque and speed output. Knowing the electrical power into the motor and the mechanical power out of the motor, we determine the motor’s efficiency. If you’ve got a gearbox, we can measure its mechanical power output and calculate its efficiency as well. These tests are very temperature-dependent because when machines get hot, they lose more energy and they’re less efficient. So, keeping the machine in a really tight temperature range is an area of interest for engineers.
We designed the eDrive, HBK’s product that simultaneously measures all mechanical and electrical values—torque, speed, temperature, voltage, current, etc. These measurements are stored on the fly, along with the data from the powertrain’s control system. Post-processing analysis will compare the physical quantities with the values the controller is “thinking” or estimating, allowing engineers to design and optimize the control system.

We put the battery, inverter and motor on a dynamometer, and enter a number of setpoints that fix a torque and a speed for the full range of the powertrain. For each condition, we measure the battery power, the inverter power and the motor’s mechanical power output to determine inverter efficiency and motor efficiency. As we do this, we create an efficiency map. We put speed on the X-axis and torque on the Y-axis. We want to figure out where the most efficient points are so the powertrain can operate there the majority of the time.
Then the engineers will use this data to optimize the powertrain and also define the vehicle’s driving mode parameters. For example, they can look at the efficiency map and say, “Okay, in unbridled mode at an ambient temperature of 20° C, my battery state of charge is this. I can be this liberal with how I’m operating.” Or, say, “It’s 40° C—very hot. My battery is at a really low state of charge. I’m in dire straits and need to get somewhere. I’m going to operate a little more conservatively.” This is all derived from these maps that say, “Under these exact conditions, I want to operate here.”
Testing setup
Charged: How does the pack’s state of charge affect these measurements and the efficiency?
Marks: As the battery’s state of charge gets lower, you might lower the bus voltage to try to conserve energy. Or some fundamental functions in the battery move it to a lower voltage level. So that state of charge is going to affect where that DC bus is sitting or how much current you’re willing to provide.
During testing, engineers use power supplies that simulate the battery packs, and there are a lot of really good battery emulation systems on the market. One of the problems with using real batteries for testing is that there are a whole bunch of safety concerns that go into it, and it gets expensive.
Charged: What about the rest of the test setup? How many test bench rigs are EV makers typically operating in parallel?
Marks: It depends on the size of the automaker. If you look at GM, for example, they’ve got one facility with a hallway that’s got 120 dynamometers that are pretty much all the same. They can use those for powertrain efficiency mapping, NVH testing, etc. There is a cart where they bring in the motor, a technician connects it, closes the door and runs the test. That’s General Motors—as good as it gets. On the other hand, we’ve seen labs of startups where they might have something that’s more cobbled together, operated by a person whose real job is something else. So, it varies.
The load machines are pretty standard. For example, if you run a 100-kilowatt device under test, you’ll have a 200-kilowatt load motor, and then you can run peak power where you overload the machine and run the whole gamut. Those dynamometer systems are really good at just holding a stiff speed and absorbing torque without fluctuating too much. The good ones are really expensive and the bad ones are really unreliable. But you typically have one machine that can take most of the motors you’re going to put on it.
Also, eDrive formulas can be modified for motors with more than three phases or systems with more than one motor. Extra inputs allow users to connect temperature sensors, accelerometers, microphones, a CAN bus and more. We also include a suite of analysis tools and users can create custom analyses as well.
Since we’re measuring all aspects of mechanical and electrical efficiency, we can help engineers who are designing the individual components—the battery, the inverter, the motor and the control system—to optimize those parts so they work together to make a better overall powertrain.
Since all raw data is stored on the fly, the measurements can be examined in detail as often as necessary, eliminating the need to rerun tests at certain operating points. Because of the additional sensors, eDrive can calculate iron losses and copper losses. And since we’re measuring all aspects of mechanical and electrical efficiency, we can help engineers who are designing the individual components—the battery, the inverter, the motor and the control system—to optimize those parts so they work together to make a better overall powertrain.
Next-gen testing
Charged: Where do you see this efficiency mapping industry moving in the future?
Marks: Testing is expensive. A dynamometer, for example, runs you a million bucks. The measurement equipment and time to test is not inexpensive, so everybody’s moving to computer models or digital twins. You’ve got a digital twin of the motor, a digital twin of the inverter and a control algorithm. A lot of times, you’re just getting your computer model to be as close to reality as possible so you can just hit Enter on a computer, run all these tests and validate the algorithm on the test stand. Everybody’s moving towards more hardware in the loop, simulated motors and simulated inverters. It’s a cool time to be in development and an interesting time for test people, but we’ll always be here because you’re always pushing the envelope and need to validate.

Charged: In those scenarios, when they’re moving to computer model or digital twin, they will constantly check against real life using your equipment. Is that right?
Marks: Right. We need to have validation so when something goes wrong in the field, we can identify what happened quickly. And then we have the guy who just wants to figure out the best algorithm, refine his model, hit go, and then validate. That’s the dream, but I don’t think we’re there yet.
This article appeared in Charged Issue 55 – May/June 2021 – Subscribe now.
Source: Electric Vehicles Magazine